Polkawatch Observability
Polkawatch operational insight. Black-box monitoring and observability of Substrate DAPPs with Node-Red.
In our last Kusama Treasury proposal we agreed to improve Polkawatch observability. In an attempt to make this work more useful to our community we decided to share all the details in this Operational Insight blog post.
We love tools like Grafana and Prometheus, most of our components are integrated with them including our Polkadot and Kusama Archive nodes.
While we think these tools excel at monitoring all the insights of each individual component, we find it difficult to get an idea of how our full-stack service is performing, in general.
Operating our Stack
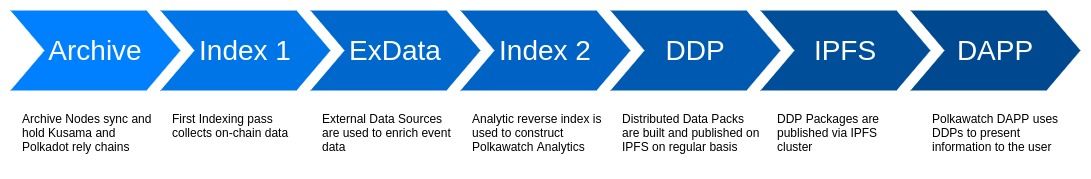
Polkawatch Stack is similar to a Substrate indexing application with a DAPP as frontend. However, our stack includes also archive nodes, 2 levels of indexing (chain facts + analytics) and the production of data packs for the DAPP which are published over IPFS.
Many things can go wrong, at each level. And we don't want to have to monitor key metrics of every module to keep our operation agile.
Black box observability for Decentralized Applications
How can we observe the maximum number of components in our stack in the simplest possible way?
We find it useful to publish via Polkawatch own API metrics about the dataset. For example, the timestamp of the last processed Reward Event. If ANY component in our stack misbehaves, that timestamp will start to drift back in time.
In Polkadot, for example, Rewards are issued every day, so, a 24h age of the last Processing event can be considered normal, 48h means something has failed, perhaps not permanently, 72h signals a deeper problem, etc.
Furthermore, because our DDPs are published via IPFS, during monitoring we can request the API information via Public IPFS gateways, that way we also verify our IPFS infrastructure at the same time.
Introducing Data Quality Observability
We are now also introducing a second metric related to data quality. Our API includes now a metric which reports the percentage of rewards that could be successfully traced. The feature is introduced in our Kusama stack first, Polkadot will follow.
A reward event is successfully traced when its Network, Country, Operator, etc can be determined. This process can fail, for example, when a geolocation IP database is missing information. A small percentage of rewards not traced can be considered normal.
Data Quality and Dataset age metrics allow us to deliver black box full stack observability without a single direct request to our stack.
Getting information that matters
Polkawatch is not such a big project as to justify full time operational staff. We manage operations part-time while developing new features for Polkawatch and/or developing other new Projects.
For us, it is important to get the operational information that actually matters via the channels at which we are normally present, for example Matrix/Element messenger.
In the past, for IOT projects we have used Node-Red to quite easily maintain visual workflows that integrate with multiple components. This software is ideal to implement observability in a distributed system that it is easy to maintain.
It was great to find out that Zooper Corp team, details below, had already implemented Polkadot support for Node-Red.
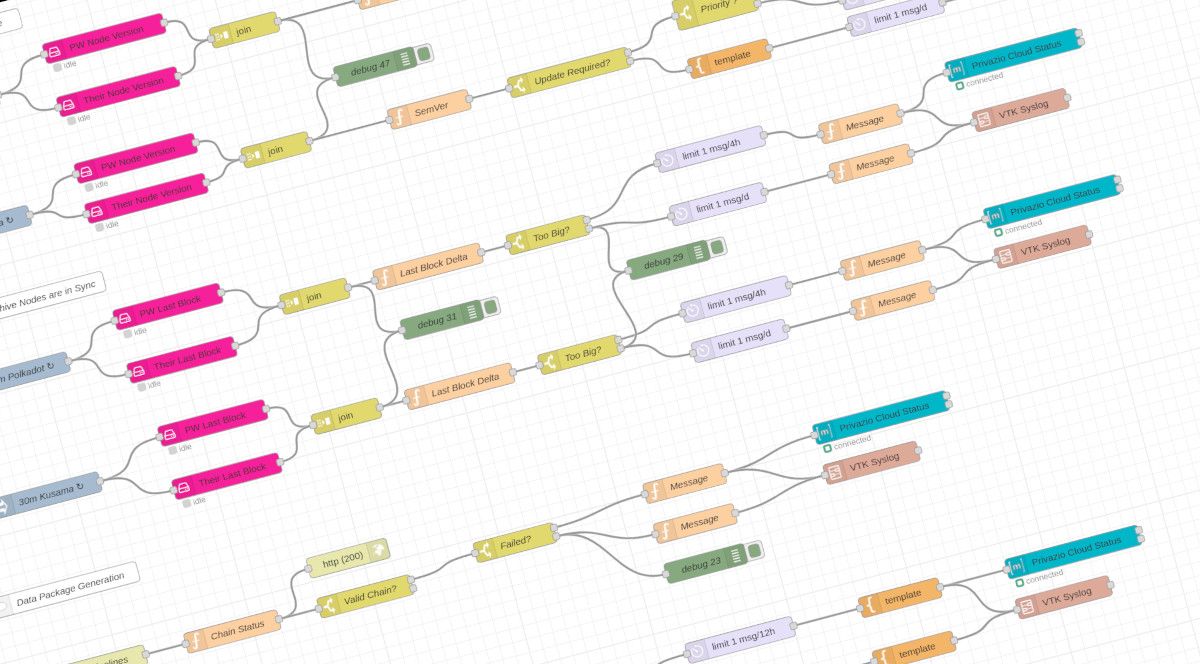
It was very straight forward to adopt Node-Red while implementing observability the way we like it. Here is an example of the flow discussed above:

Every 30 minutes a Public IPFs endpoint is used to get information about the dataset, the Age of the last Reward event is selected. If the event is too old a message (1 max per 12h) is delivered via Matrix to the team. If Age is OK, a different message is logged via Syslog.
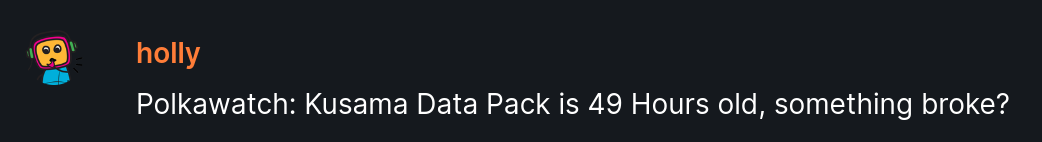
We find it useful to generate intuitive messages that include also intuitive severity, as shown. In our case the number of hours in age is easy to understand. Message frequency is also limited based on severity.
Sometimes our stack may run for weeks without a hiccup, and for those periods we find it very useful to leave an equally easy to read trail of syslog messages that serve as testimony that everything is going just fine, just a few messages per day. For example:
polkawatch[0]: DDP Generation on kusama finished OK
polkawatch[0]: Kusama Data Pack seems OK, currently 23 Hours old.
polkawatch[0]: Kusama node is in sync, delta is 3.
polkawatch[0]: Our Kusama Node v0.9.41 is up to date.
Observability in a decentralized ecosystem
With this setup we can very easily observe our stack as a member of our distributed community.
For example, we find it useful to observe if the last block of our nodes drifts when compared to reference nodes in our ecosystem, i.g. those of our top RPC operators.
We can also check if the Node version drifts when compared to reference node operators in our ecosystem, as follows:

In this flow, the RPC interface of our node and a reference node is used to retrieve the nodes versions. Semantic versioning is used to calculate the delta between the two versions and its type (patch, minor, major). Priority is assigned based on this delta, and intuitive messages are delivered based on this information.
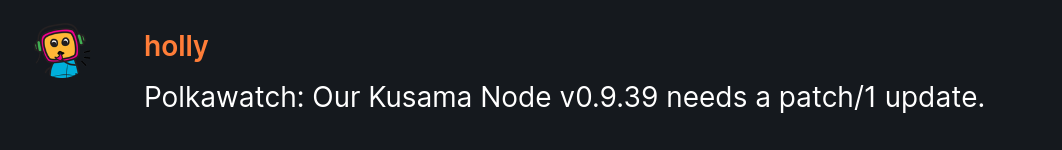
The message above will be sent maximum once every 3 days, with the current flow setup.
Our takeaway
Observability in our decentralized ecosystem has its peculiarities many of which help us monitor our infrastructure easier than in other environments.
Node-Red is a fantastic tool to create agile workflows that allow us to observe our infrastructure very easily and intuitively while taking advantage of decentralization. Node-Red workflows are easy to maintain.
When something fails, we have Grafana, Prometheus, and log servers to have a closer look, until the issue is resolved
About Polkawatch
Polkawatch is an analytic tool designed to measure effective decentralization of Polkadot’s Validation process.
Polkawatch is a project originally supported by the Web3 Foundation grants program and currently supported by the Polkadot and Kusama treasuries.
About ZooperCorp
Zooper Corp is the Interplanetary PoS Blockchain Validator. A team of DevOps experts that maintains several DotSama validators including Polkadot, Kusama, Moonbeam and Moonriver.
Zooper Corp is part of the Web 3 Foundation 1KV Validator Program and is the original contributor of the Node-Red plugin for Polkadot, they can be reached on Twitter.
About Node-Red
Node-RED is a programming tool for wiring together hardware devices, APIs and online services in new and interesting ways.
It provides a browser-based editor that makes it easy to wire together flows using the wide range of nodes in the palette that can be deployed to its runtime in a single-click.